Analyzing Environmental Insights Using Python and SQL

✅ Extracted insights from 53K environmental readings.
✅ Cleaned, preprocessed, and quality assured the dataset.
🌐 SQL Queries:
1️⃣ Average temperature recorded for each device.
2️⃣ Top 5 devices with highest average carbon monoxide levels.
3️⃣ Average temperature recorded in the dataset.
Covid-19 Data Analysis Using SQL and Data Visualization Using Tableau

🔧 Tools: Python, MySQL
📊 Data: COVID19 DATA from https://ourworldindata.org/covid-deaths
🌐 SQL Queries
📊 Queries for total cases, deaths, death percentage by location and date.
💀 Likelihood of Dying: Calculate "DeathPercentage" in different countries.
📈 Percent Population Infected: Analyze the percentage of population infected ("PercentPopulationInfected1").
🌍 Countries with Highest Infection Rates and Death Counts.
PlayStore Apps Data Analysis Using Python and SQL
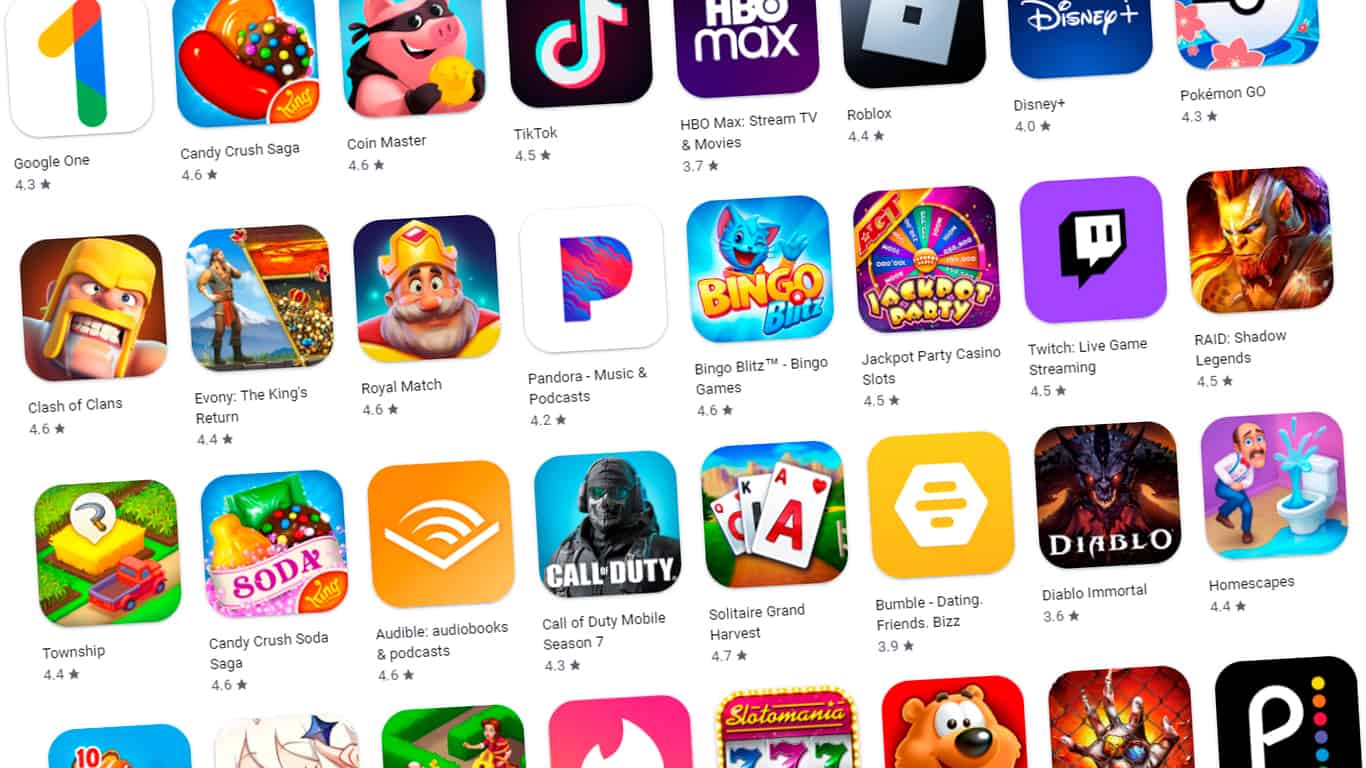
🛠️ Tools: Python, SQL, Pandas
📊 Dataset: Playstore apps dataset (26,000 records)
✅ Cleaned and transformed a dataset of 26,000 mobile app records, removing unnecessary columns and improving efficiency.
📈 SQL Queries:
1️⃣ Identified top 10 apps with the highest ratings.
2️⃣ Obtained installs and reviews for the top 5 most reviewed apps.
3️⃣ Found the app with the highest number of reviews and its category.
Youtube Songs and Spotify Streams Analysis Using Python and SQL

🛠️ Tools: Python, SQL, Pandas
✅ Cleaned and transformed a massive dataset of twenty thousand users, reducing data size by 30% through removal of unnecessary columns, handling null values, deduplication, and conversion of durations to minutes.
🌐 SQL Queries:
1️⃣ Most viewed YouTube track.
2️⃣ Most streamed Spotify track.
SQL Data Cleaning

📅 Standardized the Sale Date Column: Transformed the `sale_date` column to DATE format, removing the time component.
🔍 Addressed Null Values: Filled null entries in the property address column using Parcel ID-based self joins.
📍 Optimized Address Data: Segregated the property address into distinct address and city columns.
✉ Further Address Optimization: Split the owner address into address, city, and state columns for detailed data analysis.
🧹 Data Cleaning Initiatives: Purged duplicate rows, deleted superfluous columns, and standardized data formats for precise interpretation.
💡 Actionable Insights: Recommended cleaning further columns, visual data exploration, predictive housing price models, and enriching the dataset with external data sources.