Ghulam Murtaza Portfolio

Data-driven professional with proficiency in PowerBI, showcasing analytics dashboards and more. Connect with me on @My_Linkedin.

HR Analytics Dashboard

HR Analytics Dashboard Image

๐ŸŽ› Dynamic Dashboard Creation: Implemented parameters and calculations for interactive, real-time HR metric adjustments.

๐ŸŒ Diverse Visualization Tools: Developed geographic maps, bar charts, and line graphs showcasing hiring trends, regional statistics, and retention rates.

๐Ÿ–ผ Optimized Dashboard Design: Structured visuals in strategic containers, ensuring an intuitive user experience.

๐Ÿ–ฑ User Interactivity: Incorporated filters and toggles, enabling users to dive deep into specific HR insights and view data adjustments dynamically.

๐Ÿš€ Future Expansion: Envisioned date filters, expanded geographic insights.


PowerBI does not allow reports to be shared outside organization, To view Dashboard, click on View Dashboard to download or you can view pdf for quicker view

👍
0

Data Professional Survey Breakdown Dashboard

Data Professional Survey Dashboard Image

๐Ÿ“ Data Preparation: Survey data of 630 respondents imported into Power BI. Columns split and renamed for clarity.

๐Ÿ“‰ Visual Insights: Showcased metrics like the average age (~30 years), data scientists' salary ($93K), and the popularity of Python as a programming language.

๐ŸŒ Geographical Analysis: Majority of respondents from the US, India, and Canada, with US data scientists earning an average of $139K.

๐Ÿ™‚ Satisfaction Metrics: Work-life balance rated 5.74/10 and salary satisfaction at 4.36/10.

๐Ÿšป Gender Salary Divide: Highlighted salary differences with females earning $55K on average, and males $53K.


PowerBI does not allow reports to be shared outside organization, To view Dashboard, click on View Dashboard to download or you can view pdf for quicker view

👍
0

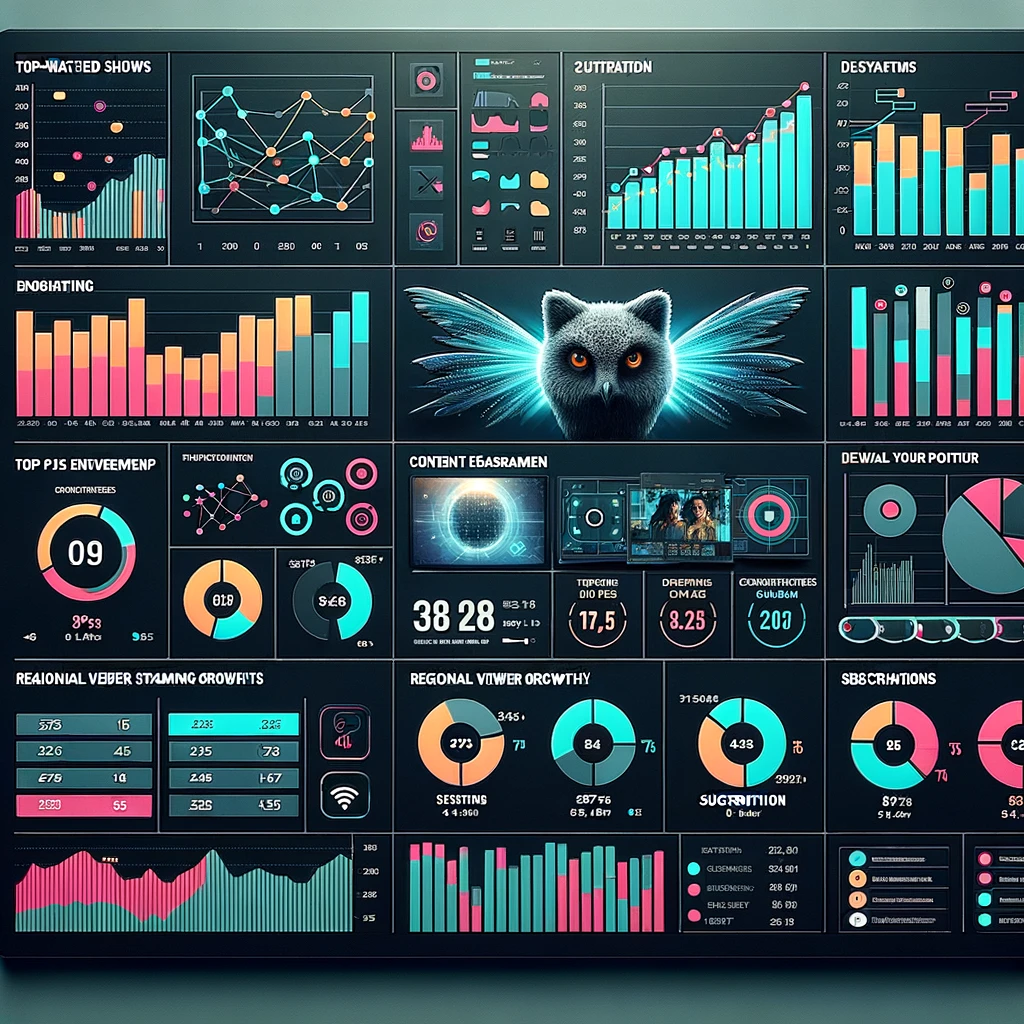
OTT Platform Dashboard

OTT Platform Dashboard Image

๐Ÿ—ฃ๏ธ Language Analysis: A comprehensive chart showcasing the count of views categorized by different languages, revealing audience preferences and regional popularity.

๐Ÿ“† Yearly Distribution: An insightful breakdown detailing the count of views by year, allowing stakeholders to track content performance over time and identify emerging trends.

๐ŸŒŸ IMDb Category Insights: A detailed visualization presenting the count of views based on IMDb categories, giving a perspective on which types of content are resonating most with the audience.

๐ŸŽฌ Genre Analysis: A chart that breaks down the count of views by genre, providing clarity on the kind of content genres that are most sought after by viewers.

๐Ÿ” Date Filter: An integrated date filter functionality, empowering users to refine their data view and focus on specific time frames for a more granular analysis.

👍
0

Road Accident Analysis Dashboard

Road Accident Analysis Image

๐Ÿ“‹ Requirement Gathering: Identified client needs like year-on-year metrics, severity analysis, monthly trends, and location-based insights.

๐Ÿ”— Connecting to Data: Linked Excel accident data to Power BI, ensuring data integrity.

๐Ÿงน Data Cleaning and Processing: Rectified errors using Power Query, added columns for better sorting, and established date hierarchies.

๐Ÿ”— Data Modeling: Linked accident data to a calendar table for enriched time-based analysis.

๐Ÿ“Š Creating KPI Visuals: Displayed key metrics like casualties, growth, and severity with styled visuals.

๐Ÿ“ˆ Building Other Charts: Introduced charts for monthly trends, casualty splits, road type insights, and a bubble map for locations.

๐Ÿ” Integrating Interactive Filters and Slicers: Integrated slicers and set filter interactions to enhance dashboard interactivity.


PowerBI does not allow reports to be shared outside organization, To view Dashboard, click on View Dashboard to download or you can view pdf for quicker view
👍
0

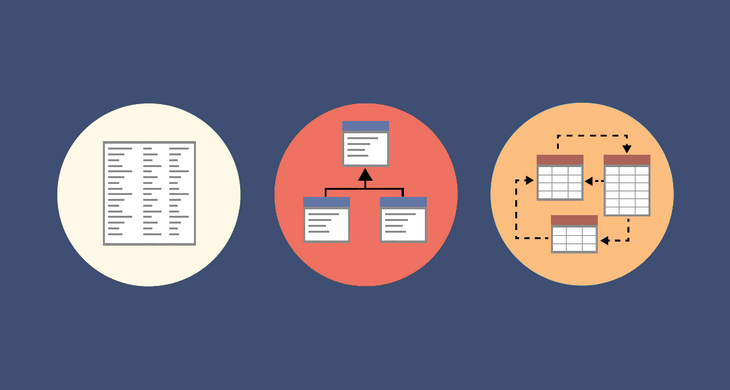
Data Modelling in PowerBI

Road Accident Analysis Image

๐Ÿ’ก Learnt:

๐Ÿ“š What is a data model? Power BI's structured data representation crucial for accurate reporting and insights.

๐Ÿ“‹ Fact and dimension tables: Distinguishing between quantitative fact tables and descriptive dimension tables.

๐Ÿ”— Relationships: Establishing connections between data tables for effective data querying.

๐Ÿšฆ Cardinalities: Understanding one-to-one, one-to-many, and many-to-many relationships in data modeling.

๐Ÿ”„ Active and inactive relationships: Differentiating between default and alternative table relationships using DAX for inactive ones.

๐Ÿ” Schemas: Grasping star, snowflake, and galaxy schemas and their design principles.

๐Ÿ“ Action Items: Importance of clean data, accurate relationships, model validation, and continuous improvement.

👍
0